Currently, the world population has a total fertility of about 2.5 children per woman. With this fertility the population will continue to increase significantly, because only about 2.1 children would be sufficient to replace one generation with the next generation. The figure above presents, in addition to the world average, the regions with the highest and the lowest fertility: Africa and Europe.
Africa, currently has an average total fertility of about 4.7 children per women - far more than would be necessary to replace a generation.
Europe, on the other hand, has a total fertility of around 1.6 - which is far below the level that would be necessary to replace one generation with the next.
However, since the early 1990s Northern America has a significantly higher total fertility than Europe. Social and economic problems, related to low fertility, such as population aging, are therefore less severe in Northern America than in Europe
Consequently, Africa's population is still growing rapidly.
Countries with TFR > 2.5, 2010-2015
For instance, Niger, Somalia, Mali, Chad, Angola, the Democratic Republic of the Congo and Burundi have all an average total fertility of more than 6 children per women. There are also 16 African countries, where the total fertility is between 5 and 6 children per woman.
This total fertility is far higher than would be necessary to replace one generation with the next. It is causing the current explosive population growth in these regions.
Countries with TFR < 2.1, 2010-2015
There are 24 countries, where the average fertility is between 1.5 and 1.6 children per women; and there are even 17 countries, where the total fertility is between 1.1 and 1.4 children. This is far below the level necessary for reproduction.
All of the countries with extremely low, below-replacement, fertility are in Asia and Europe - including countries such as Japan, Germany, the Republic of Korea, Poland and Italy.
One could also use cohort-specific measures of fertility or adjust ferility rates using parity progression ratios in order to determine the "true" level of fertility in a population.
However, the bottom line is still the same: All the countries with a sustained average (period) fertility of below 1.5 children per women have, or will eventually have, serious demographic problems of population aging and decline.
Over the past decades researchers have repeatedly argued that extremely low period fertility would be only a temporary ("timing") effect that would disappear when family formation is completed. However, we still have a significant number of countries, where (period) fertility continues to be extremely low - over periods of up to 35 years.
Myrskylä, Mikko / Goldstein, Joshua R. / Cheng, Yen-Hsin Alice (2013): New Cohort Fertility Forecasts for the Developed World. Max Planck Institute for Demographic Research, Working Paper 2012-014, February 2012 (Revised April 2013)
Ortega, José Antonio / Kohler, Hans-Peter (2002): Measuring Low Fertility: Rethinking Demographic Methods. Max Planck Institute for Demographic Research, Working Paper 2002-001, January 2002
Bongaarts, John / Feeney, Griffith (1998): On the Quantum and Tempo of Fertility. In: Population and Development Review, Vol. 24, No. 2, 271-291
Andersson, Gunnar / Rønsen, Marit / Knudsen, Lisbeth B. / Lappegård, Trude / Neyer, Gerda / Skrede, Kari / Teschner, Kathrin / Vikat, Andres (2015): Cohort fertility patterns in the Nordic countries. In: Demographic Reseaearch, Vol. 20, Aricle 14, 313-352
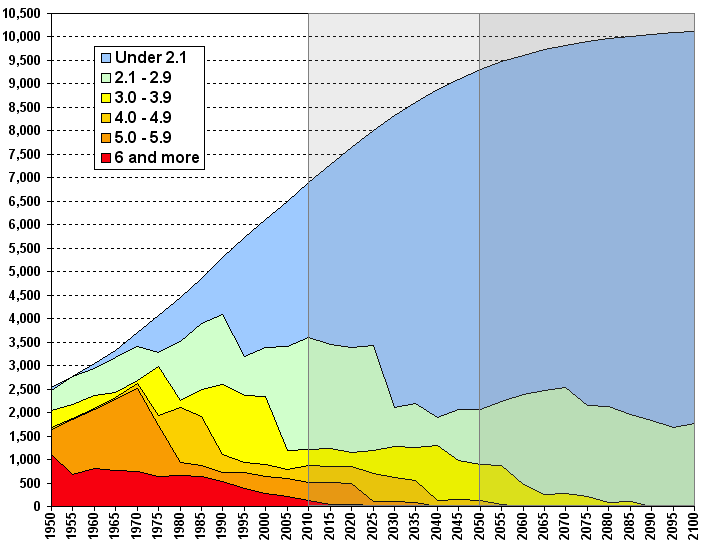
In the early 1950 more than half of the world population had fertility rates above 5 children per woman.
Today, more than half of the world population already have fertility rates below 2.1 children per woman - as a result of the steep fertility decline in China.
Very soon, only a minority of people will have fertility rates of more than 3 children per woman - mostly countries in Africa and the arabic world.
_YB15.png)
Overall, the EEUROSTAT estimate for the 28 European member countries is at 1.55 children per women for the year 2013.
This is very much in line with the estimate of the United Nations Population Division as published in the 2015 Revision of the World Population Prospects.
Over the same period, mean age at childbirth has increased from 29.0 years in 2001 to 30.3 years in 2013.
Average fertility in Europe is far below the level that would be necessary to replace one generation with the next. As a consequence, Europe's population will age and (eventually) decline.
Massive net-immigration could compensate these effects of sub-replacement fertility to some extent - for the price of social, cultural and economic distruptions due to high numbers of non-european immigrants.
The most natural and appropriate demographic response to extremely low levels of fertility in Europe would be an increase in fertility to the level of about 2.1 children per woman.
This would eventually re-balance the relation between generations, significantly slow-down population aging and prevent long-term population decline.
Goldstein, Joshua R. and Tomas Sobotka, Aiva Jasilioniene (2009): The End of 'Lowest-Low' Fertilit?. Max-Planck-Institut for Demographic Research, Working Paper WP 2009-029
Grant, Jonathan and Stijn Hoorens, Suja Sivadasan, Mirjam van het Loo, Julie DaVanzo, Lauren Hale, Shawna Gibson, William Butz (2004): Low Fertility and Population Ageing. Causes, Consequences, and Policy Options. RAND Europe, Prepared for the European Commission.
The population in all of these countries has far fewer children than would be necessary to replace one generation with the next. Their total fertility is as low as 1.3 children per woman.
Since most of these European countries now have sub-replacement fertility for many decades, their population is ageing and they soon will beginn to decline - or have already started to decline.
In Italy, Switzerland and Spain women are between 1.5 and 2 years older at birth of their first child than on average in the 28 countries of the European Union.
In the Eastern European and Western Asian countries of Armenia, Moldova, Azerbaijan, Ukraine, Georgia and Belarus mean age of women at birth of first child ar at least 3.5 years younger than the EU average
In several countries, including Iceland, Bulgaria, Estonia, Slovenia, France and Norway, 50% of all births or more occur out of marrage.
But there are also countries, including Turkey, Greece, Armenia, Bosnia and Herzegovina, and the FYR of Macedonia, where more than 85% of all births are within marriages.
A Net Reproduction Rate of 1 indicates that one generation is precisely replaced by the next generation. With a NRR of below 1 the population is (intrinsically) shrinking, with a NRR of more than 1 the population is growing.
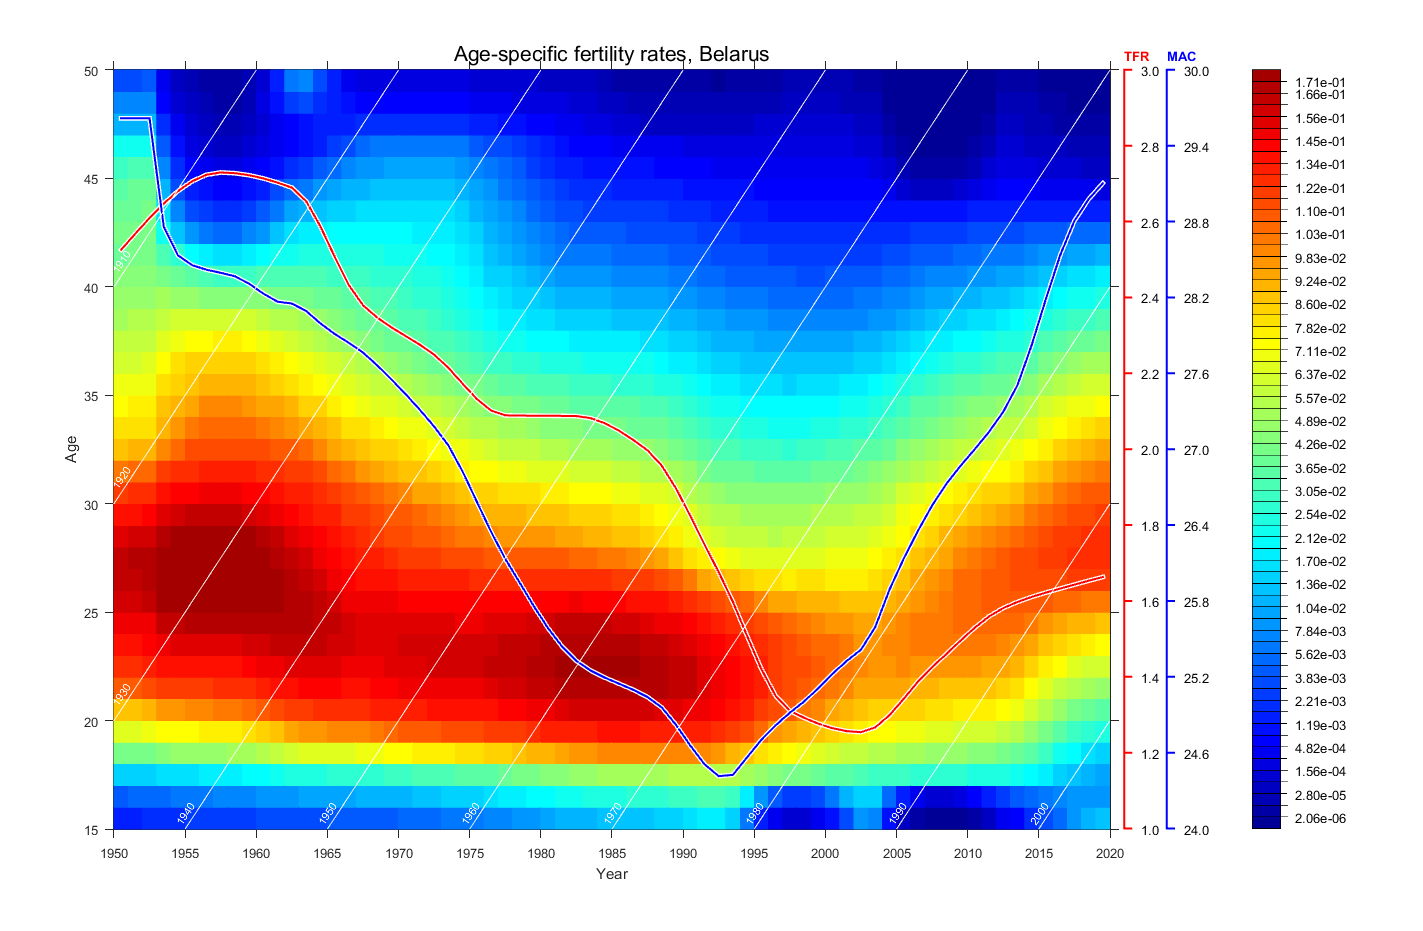
Blue colors represent low fertility; red colors represent high age-specific fertility. In addition, the figure shows the mean age at childbearing (MAC); as well as the Total Fertilit Rate (TFR).
One can easily see that fertility has droped significantly since the 1950s and has reached its lowes level in the 1995-2010 period. It is remarkable that the mean age at childbearing also reached its lowest level in the 1990-1995 period.
Since then, the age at childbearing has increased sigificantly, while the total fertility has only recovered moderately since about 2005.