Overview
Updated: 21 April 2017
Population Growth & Decline
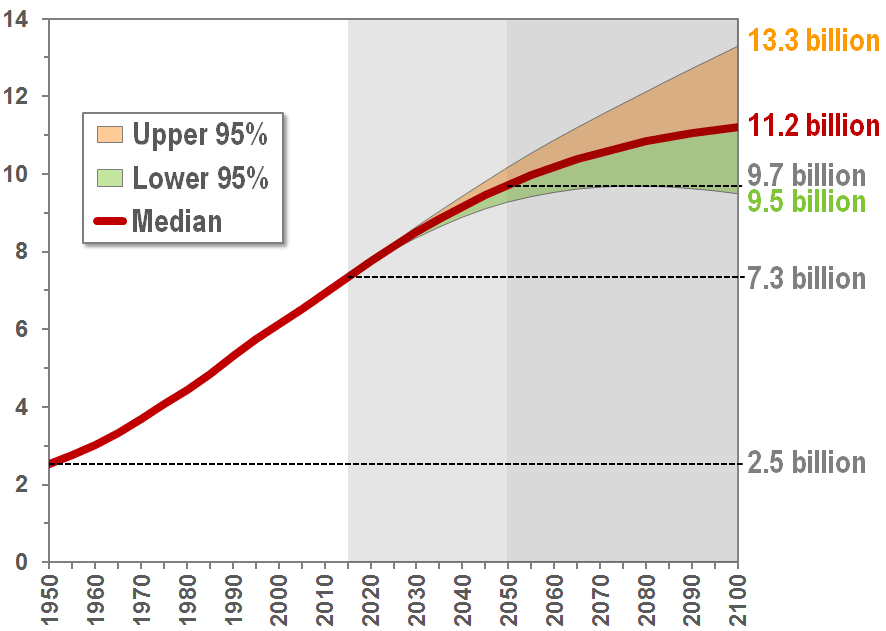
Source: United Nations, PPP2015
World population growth has been unprecedented since the middle of the 20th century (see figure above). In this chapter estimates and projections of population growth and decline are presented for major regions and many countries of the world.
Births & Deaths
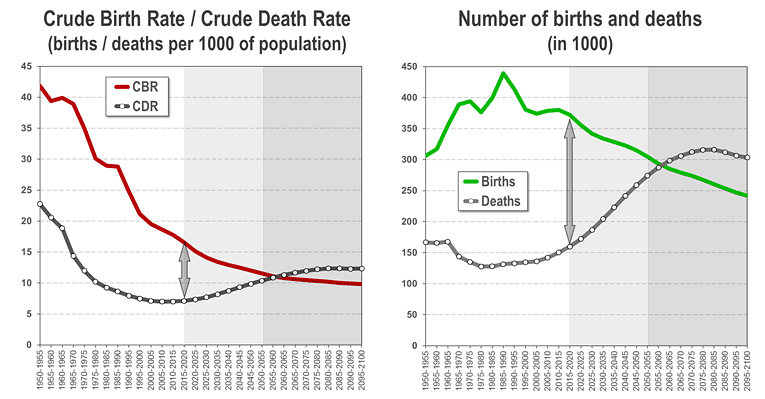
Source: United Nations, WPP2015
The number of births has outpaced the number of deaths in many parts of the world since the 1950s, causing massive population increase - particularly in Asia (as shown in the chart above). However, birth rates have frequently been falling in recent decades, most dramatically in Europe. This chapter presents data on births and deaths, as well as birth rates and death rates for major regions of the world.
Population Distribution
Source: United Nations, WPP2015
As a consequence of rather divergent trends in population growth (and decline), we have observed a significant change in the geographical distribution of people. While the share of the world's population living in Europe has sharply declined, the percentage of people living in Asia as increased. In the future, Africa's share of the world population will increase sharply due to the explosive population growth of the continent. This chapter presents the changes in global population distribution between 1950 and 2100.
Population density
Chart prepared by Gerhard K. Heilig, 2014; Data source: United Nations, WPP2012: Medium Variant.
Resulting from divergent trends in population growth, population densities in various parts of the world have already changed significantly. While the population density has increased in many parts of Asia it has changed little in Europe. Over the next few decades population density will increase enormously in many parts of Africa. Already in 2050, Western and Eastern Africa will be more densely populated than Southern Europe - and much more densely populated than Eastern Europe.
Age Structure
Chart by GKH. Data source: United Nations, WPP2015
In 1950, some 398 million people worldwide were age 50 or older. Today, their number has quadrupled to more than 1.6 billion. Within only 35 years, their number will more than double again to 3.2 billion and by the end of the century it is quite possible that worldwide almost 4.5 billion people will be age 50 or older. By then 2 of 5 people may be in that age group. However, trends in age structure change are very different from region to region. This chapter highlights some of these divergences - particularly the striking contrast between Africa and Europe.
Population aging
Chart by GKH. Data source: United Nations, WPP2015
Most people assume that an increase in average life expectancy is causing population aging. However, rising life expectance is only one, usually relatively small, component of population ageing. In most cases, the main factor is a decline in fertility.
This chapter will explain what population ageing is about, how it can be measured and what consequences it might have for society.
This chapter will explain what population ageing is about, how it can be measured and what consequences it might have for society.
Urbanization

Photo: Shinjuku Skyline Tokyo, Japan. October, 1996, Author: Kronks
Urbanization is one of the mega-trends of our time: While most people were rural residents only a few decades ago, already half of the world population now lives in urban areas. This process of urbanization is far from over. We can expect that in the forseeable future two-thirds of all people will live in cities and huge urban agglomerations.
Fertility
Chart by GKH. Data source: United Nations, WPP2015
This section presents trends in total fertility rates, as well as net reproduction rates, for all major regions and all countries of the world between 1950 and 2050.
The figure above shows the decline in total fertility since the 1950s for Africa, Europe and the World.
The figure above shows the decline in total fertility since the 1950s for Africa, Europe and the World.
Mortality / Life Expectancy
Chart by GKH. Note: Scale starts at age 40. Data source: United Nations, WPP2015
There was a spectacular decline in infant and child mortality since the 1950. As a result, life expectancy at birth increased in all major regions of the world.
This section presents data and results on child and infant mortality, as well as life expectancy for selected countries and major regions of the world.
This section presents data and results on child and infant mortality, as well as life expectancy for selected countries and major regions of the world.
Migration
Data source: United Nations, Department of Economic and Social Affairs (2015). Trends in International Migrant Stock: The 2015 revision (United Nations database, POP/DB/MIG/Stock/Rev.2015).
The table above presents the most recent estimates of the migrant stock by major world region. In 2015, almost 244 million people worldwide did not reside in the country they were born or were registered as foreigners. This stock of migrants and refugess was much smaller in 1990 - only some 153 million.
Note: The data used to produce the estimates refer to the foreign-born population or to foreign citizens. Whenever available, the number of refugees, as reported by UNHCR, were added to the estimate of international migrants. Estimates for countries or areas having no data on the number of international migrants were obtained by imputation.
Questions & Answers
Diagram by GKH
This section answers frequently-asked questions on global demographic trends.