Five-year population increase, 1950-1955 to 2095-2100
World population increase has peaked in the five-year period between 1985 and 1990, when 457 million were added to the world population. However, increases in world population have not declined much since then. Between 2010 and 2015, the world population grew by some 420 million people - not much less than in the late 1980s.
The number of people added to the world population in each subsequent five-year period is projected to decline - but only after 2050 will the numbers added to the world population be smaller than in the early 1950s.
Five-year population increase, 1950-1955 to 2095-2100
Africa has experienced, and will further see, explosive population growth. The continent's population will increase from some 229 million in the early 1950s to more than 4.4 billion people by the end of the 21st century (according to the median of probabilistic population projections).
By the end of the century, Africa's population could be 4.4 billion. In that case the continent will have added roughly 4.16 billion people to its 1950 population - all within a 150-year period.
It can be expected, that the world population will increase by almost 8.69 billion people between 1950 and 2100.
More than 88% of this increase will be in Africa (47.9%) and Asia (40.2%). Latin America and the Caribbean will only contribute some 6.4% to this world population increase and Northern America just 3.8%
Europe and Oceania will contribute just 1.1% and 0.7% to the world population increase between 1950 and the end of the 21st century.
The enormous increase of the world population from 2.5 billion in 1950 to most likely 11.2 by the end of the 21st century will essentially happen in Africa and Asia.
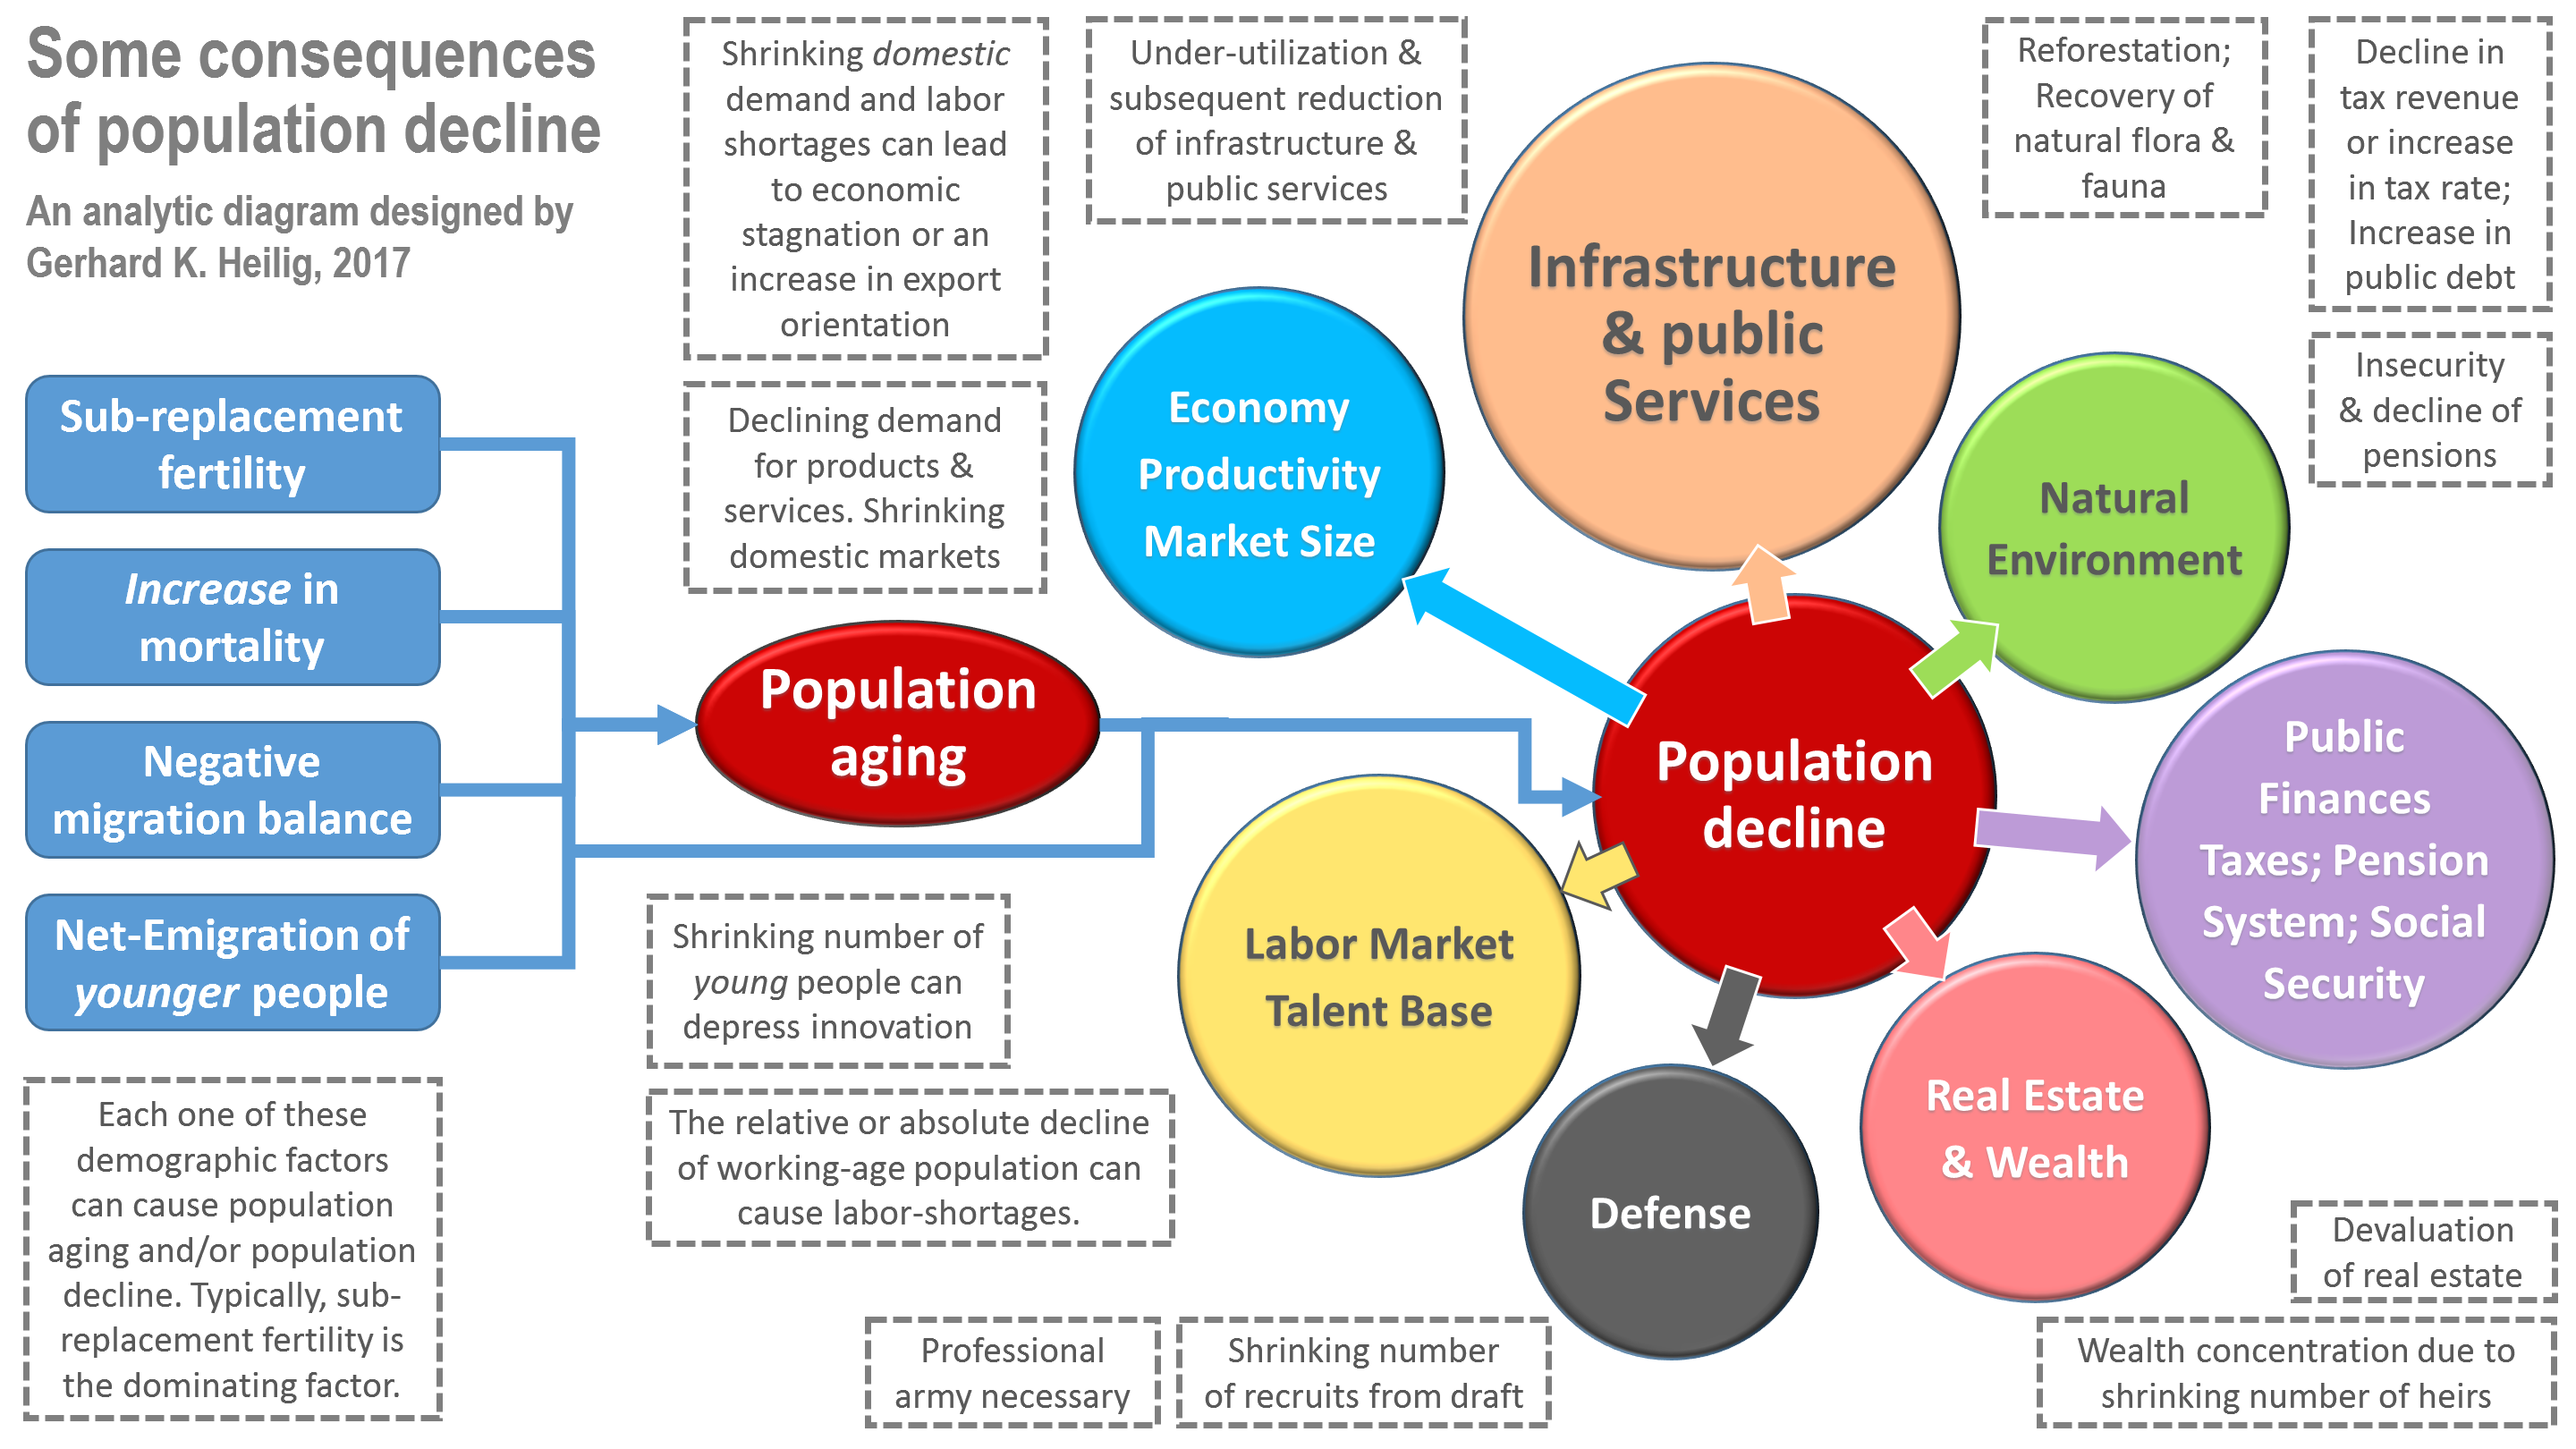
(1) A drastic fertility decline to the sub-replacement level.
(2) An increase of mortality - such as during war or natural disaster.
(3) A negative overall migration balance, and
(4) a significant net-emmigration of young people (even when overall migration is balanced). The loss of young people is causing population aging and leads to a shrinking in the number of potential parents, which will cause a decline in the number of births und thus population decline (even with constant fertility).
The consequences of population decline depend on the particular social, economic and political system. In densely populated countries population decline may be an advantage, because it reduces the burden on the environement. Population decline in sparsely populated countries, such as in many parts of Eastern Europe, can lead to population collapse and economic decline. Mostly affected by population decline are existing infrastructure and services that become under-utilized and therefore costly. Population decline can also threaten public finances, as well as pension and social security systems - in particular when combined with population aging. (See diagram for details.)
(2) Over the coming 35 years it is quite likely that India's population will grow by another 394 million - in stark contrast to China, where the population will actually decline by some 28 million between now and 2050. The country with the second largest population increase will be Nigeria, with an additional 216 million between today and 2050.
(3) In the second half of the 21st century, when predictions are, of course, more uncertain, Nigeria will be, by far, the country with the highest population increase: Nigeria could add some 354 million people to the world population between 2050 and 2100. The countries with the second and third biggest population increase will also be in Africa: the Democratic Republic of the Congo and the United Republic of Tanzania, which will increase their population by 193 and 162 million, respectively.
(4) In the 150-year period between 1950 and 2100, India will be the country that will add, by far, the largest number of people to the world population: 1.28 billion. Nigeria could add 714 million; but China "just" 460 million.
Democratic Republic of the Congo, United Republic of Tanzania, Belarus
By the end of the 21st century the DR Congo might have a population of 389 million and Tanzania of 299 million. The population of Belarus will probably have declined to 7 million.
Ethiopia, Egypt, Poland

By 2100, Ethiopia's population could be around 243 million and Egypt's population could be some 201 million. However, the population of Poland will probably decline to 22 million.
Nigeria, Pakistan, Ukraine
However, population growth in Nigeria and Pakistan is far from over. Nigeria's population will most likely increase to around 399 million over the next 35 years. By the end of the century, Nigeria could have a population of more than 750 million.
Pakistan's population growth will be somewhat more moderate in the future: By 2050, Pakistan will probably have a population of around 310 million; by 2100, the population could be around 364 million - significantly less than in Nigeria.
By contrast, Ukraine's population which increased moderately from 37 million in 1950 to 45 million in 2015, is projected to decline to a little more than 26 million by the end of the 21st century.
Niger, Iraq, Bulgaria
Over the next 35 years, Bulgaria's population will probably decline to 5.2 million. Iraq's population could more than double to almost 84 million - despite the political and military crises. Niger's population, however, will most likely far more than triple to 72 million people in 2050. This increase is mostly the consequence of a very "young" population, which will generate large numbers of births - despite a rapid decline in fertility.
In the second half of the 21st century Niger's population could virtually "explode" and increase from 72 million in 2050 to 209 million in 2100. Iraq's population will "only" reach about 164 million by the end of the century.
Bulgaria's population, however, might easily decline to just 3.4 million people. If that happens, the country will have experienced a real population collapse in which the population will be less than half of its peak in 1985, when Bulgaria had a 9 million population.
The United States of America, Western Europe and the Russian Federation
The United States' population is increasing continuously - from around 158 million in 1950 to some 322 million today and to most likely around 450 million by the end of the 21st century.
Western Europe increased its population from 142 million in 1950 to about 191 million today. However, the region's population growth will level off and by 2100 the population might be slightly smaller than today.
Between 1950 and 2015, the Russian Federation, which until 1991 was the core region of the former Soviet Union, also increased its population: from around 103 million to about 150 million shortly before the dissolution of the Soviet Union. Since then it has declined to about 143 million. By the end of the 21st century, the population of the Russian Federation could decline to 117 million.
In geo-politics, population size matters - as is exemplified by the rise of China and India. Populous nations can not only supply manpower for very large armies; they can also project the economic power of large labor and consumer markets, if they have a functioning economy. The Russian Federation is seriously handicapped by its demographic decline, while the United States is accumulating an increasing human resource base.
By the end of the 21st century the United States of America will probably still "play" in the same league as China and India, while the Russian Federation will have fallen back to a medium-sized power. The size of Russia's consumer market, labor force and human talent base will be more in the range of those in Western Europe.
United Nations, Department of Economic and Social Affairs, Population Division (2015). World Population Prospects: The 2015 Revision, Methodology of the United Nations Population Estimates and Projections. ESA/P/WP.242.
Raftery, A.E., N. Li, H. Ševčíková, P. Gerland, and G.K. Heilig (2012) Bayesian probabilistic population projections for all countries. Proceedings of the National Academy of Sciences. 109 (35):13915-13921. doi: 10.1073/pnas.1211452109 [open access]
Raftery, A.E., N. Li, H. Ševčíková, P. Gerland, and G.K. Heilig (2012) Bayesian probabilistic population projections for all countries - Supporting information. Proceedings of the National Academy of Sciences. 109 (35):13915-13921. doi: 10.1073/pnas.1211452109 [open access]
Raftery, A. E., L. Alkema, and P. Gerland (2014) Bayesian Population Projections for the United Nations. In: Statistical Science, 29(1), 58-68. doi: 10.1214/13-STS419 [open access]
Fosdick, B., and A. Raftery (2014) Regional probabilistic fertility forecasting by modeling between-country correlations. In: Demographic Research, 30(35), 1011-1034. doi: 10.4054/DemRes.2014.30.35 [open access]
Alkema L., A.E. Raftery, P. Gerland, S.J. Clark, F. Pelletier, T. Buettner, and G.K. Heilig (2011) Probabilistic Projections of the Total Fertility Rate for All Countries. In: Demography, 48:815-839. doi: 10.1007/s13524-011-0040-5
Alkema L., A.E. Raftery, P. Gerland, S.J. Clark, F. Pelletier, T. Buettner, and G.K. Heilig (2011) Online Resource 1 for Probabilistic Projections of the Total Fertility Rate for All Countries. In: Demography, 48:815-839. doi: 10.1007/s13524-011-0040-5
Ševčíková, H., L. Alkema, and A.E. Raftery. (2011) bayesTFR: An R Package for Probabilistic Projections of the Total Fertility Rate. in: Journal of Statistical Software, 43(1), 1-29. [open access]
Raftery, A.E., N. Lalic, and P. Gerland (2014) Joint probabilistic projection of female and male life expectancy. In: Demographic Research, 30(27), 795-822. doi: 10.4054/DemRes.2014.30.27 [open access]
Ševčíková, H., A. E. Raftery, and P. Gerland (2013) Bayesian probabilistic population projections: do it yourself. Joint Eurostat/UNECE Work Session on Demographic Projections, Rome, Italy. 29-31 October 2013.
Raftery, A. E., J.L. Chunn, P. Gerland, and H. Ševčíková, H. (2013) Bayesian Probabilistic Projections of Life Expectancy for All Countries. In: Demography, 50(3), 777-801. doi: 10.1007/s13524-012-0193-x [open access]
Li, N. and P. Gerland (2011) Modifying the Lee-Carter method to project mortality changes up to 2100. Population Association of America 2011 Annual Meeting - Washington, DC. Session 125: Formal Demography I: Mathematical Models and Methods.
Gerhard K. Heilig, Thomas Buettner, Nan Li, Patrick Gerland, Francois Pelletier, Leontine Alkema, Jennifer Chunn, Hana Ševčíková, Adrian E. Raftery (2010) A stochastic version of the United Nations World Population Prospects: methodological improvements by using Bayesian fertility and mortality projections. Joint Eurostat/UNECE Work Session on Demographic Projections, Lisbon, 23 April 2010.
Gerhard K. Heilig, Thomas Buettner, Nan Li, Patrick Gerland, Leontine Alkema, Jennifer Chunn, Adrian E. Raftery (2010) Future population trends found to be highly uncertain in Least Developed Countries. Unpublished manuscript. 16 March 2010, Population Division.
Alkema, L., A.E. Raftery, P. Gerland, S. Clark, F. Pelletier, and T. Buettner. (2010) Probabilistic Projections of the Total Fertility Rate for All Countries. Center for Statistics and Social Sciences. Seattle, WA: University of Washington. Working Paper no. 97.
Chunn, J., A.E. Raftery, P. Gerland (2010) Bayesian Probabilistic Projections of Life Expectancy for All Countries. Center for Statistics and Social Sciences. Seattle, WA: University of Washington. Working Paper no. 105.
Adrian E. Raftery, Leontine Alkema, Patrick Gerland, Samuel J. Clark, Francois Pelletier, Thomas Buettner, Gerhard Heilig, Nan Li, Hana Ševčíková (2009) White Paper: Probabilistic Projections of the Total Fertility Rate for All Countries for the 2010 World Population Prospects. United Nations Population Division, Expert Group Meeting on Recent and Future Trends in Fertility, New York, 2-4 December 2009)